General Astronomy/The H-R Diagram
The Hertzsprung-Russell diagram - usually referred to by the abbreviation H-R diagram - is a diagram that illustrates the properties of stars. As stars progress through their lives, they move around on this diagram since their properties change over time.
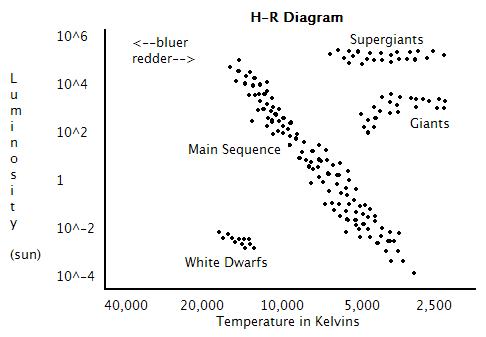
The original form of the H-R diagram consists of the absolute magnitude of the star graphed against the color of the star. It was this form that was first created around 1910 by Danish astrophysicist Ejnar Hertzsprung and American astrophysicist Henry Norris Russell, and represented a huge leap forward in understanding stars because once one graphs stars against these axes, it becomes obvious that stars fall into different categories. The diagram plots luminosity and spectral type (which also plots temperature). On the vertical plane, stars are brighter if they are higher up on the diagram. In the horizontal plane, the leftmost stars are the hottest.

When all the known stars are placed in this diagram according to luminosity and temperature, many of the stars - even our Sun - appear along a diagonal line that stretches from the top left of the diagram to the bottom right. This diagonal line is what is known as the main sequence. Stars spend the majority of their lifetimes here. It is the phase in which stars burn hydrogen into helium. At this point in a star's life, its size and luminosity remain about constant because the forces within the star have reached a near-equilibrium. The gravity of the star pointing inwards balances the internal thermal (gas) pressure which pushes outwards. The time that a star spends in the main sequence is determined by its mass. Smaller, cooler stars have slower fusion reactions rates and therefore will remain in the main sequence longer.
Stars which lie along the top right of the diagram are luminous and cool and are known as supergiants. Fainter, hotter stars - which appear at the bottom left of the diagram - are known as white dwarfs. Hot and bright stars are located at the top left of the diagram, and cool, dim stars at the bottom right.
The HR diagram is a powerful tool in astronomy that allows us to probe stellar evolution and even cosmology. Knowing a star's location on the HR diagram allows us to find its mass, its evolutionary state (and age), and its physical size. We can date individual star clusters by using the main sequence turn off, the point where main sequence stars start evolving (i.e., cease to be hydrogen burning, the initial stellar condition).
The first version of the diagram is often known as the observer's version of the H-R diagram as it can be drawn from data taken directly from a telescope. The second version of the diagram is often known as the theorist's version as it is the version against which the output from computer models can be plotted.
