Mathematica/极坐标曲面图
外观
没有内置函数可以创建极坐标3D曲面图(即高度由半径和角度控制)。但是,少量代码允许我们使用笛卡尔坐标系和极坐标系之间的恒等式来绘制一个。
我们的做法是构建一个值表,对应于一系列角度和半径的高度。让我们使用下面的函数作为示例
构建表格的第一步是定义函数并说明我们希望的绘图点之间的距离。
dtheta = Pi/20;                          (*Give a radial gridline spacing of Pi/20 radians*)
rmax = 1;                                (*Define the maximum radius*)
dr = rmax/10;                            (*Give 10 circumferential grid lines*)

f[r_, theta_] := r  Sin[theta];          (*This is the function definition*)
现在,我们根据以上信息构建高度值的表格。
data = Table[
      f[r, theta],                       (*This is the function giving the value in the table*)
      {theta, 0, 2Pi, dtheta},           (*This is the increment for theta*)
      {r, 0, rmax, dr}];                 (*This is the increment for r*)
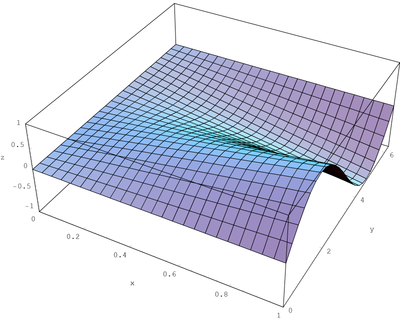
此时,我们可以使用ListPlot3D在笛卡尔坐标系中绘制数据表,其中r在x轴上,θ在y轴上,f(r,θ)在z轴上。这将生成一个普通的SurfaceGraphics输出。
gr1 = ListPlot3D[
    data,                                (*The array of height values*)
    DataRange -> {{0, rmax}, {0, 2*Pi}}];(*The range that this array covers*)
下图显示了SurfaceGraphics输出gr1。请注意,在此示例中,图像已进行抗锯齿处理。有关抗锯齿代码,请参阅图像页面。

现在我们将SurfaceGraphics对象转换为Graphics3D对象gr2,
gr2 = Graphics3D[gr1];
这是我们使用上述关系将笛卡尔图转换为极坐标图的点。我们首先定义一个规则,用于对由三个数字列表(形式为{x,y,z})给定的点执行变换。我们将它称为“替换”。
substitution = {r_, theta_, z_} -> {r Cos[theta], r Sin[theta], z};
现在,我们使用ReplaceAll函数遍历Graphics3D对象gr2,并找到每个多边形点。我们使用“:”运算符将多边形点(三个数字的列表)设置为模式对象,并为其分配名称“p”。现在我们使用RuleDelayed(:>)对每个点执行上述变换。我们不能使用Rule(->),因为这只会在其输入时进行评估,而不是在其使用时进行评估,并且不会变换点。
gr3 = ReplaceAll[gr2, p : Polygon[pts_] :> ReplaceAll[p,substitution] ]
最后一步是显示生成的极坐标图gr3
Show[
  gr3,
  AxesLabel -> {"", "", z}]             (*Retitle the axes*)
由于我们不再使用笛卡尔坐标系,因此我们无法将水平轴命名为x和y,但是,我们没有更改z的值,因此我们可以将其保留为垂直轴的名称。

对于Mathematica 6.0,请使用以下代码
MyListPolarPlot3D[data_, rRange_, thetaRange_, zRange_] :=
 Module[
  {},
  gr1 = ListPlot3D[
    data,
    DataRange -> {
      { rRange[[1]], rRange[[2]]},
      { thetaRange[[1]], thetaRange[[2]]}
      },
    DisplayFunction -> Identity,
    ColorFunction -> "SolarColors",
    ColorFunction -> Automatic,
    MeshFunctions -> {Function[{x, y, z}, x*Cos[y]],
      Function[{x, y, z}, x*Sin[y]]},
    BoundaryStyle -> None,
    ColorFunctionScaling -> True,
    Mesh -> 30
    ];

  substitution = {r_, theta_, z_} -> {r Cos[theta], r Sin[theta], z};

  gr2 = gr1 /.
    GraphicsComplex[p_List, rest__] :>
     GraphicsComplex[ReplaceAll[p, substitution], rest] ;

  (*
  * Retitle the axes and show final graph
  *)
  Return[
   Show[
    gr2,
    AxesLabel -> {"X", "Y", "Z"},
    DisplayFunction -> $DisplayFunction ,
    BoxRatios -> {1, 1, 0.8},
    PlotRange -> {
      {-0.65*rRange[[2]], 0.65*rRange[[2]]},
      {-0.65 rRange[[2]], 0.65*rRange[[2]]},
      {zRange[[1]], zRange[[2]]}
      }
    ]
   ] ;
  ]
这是一个示例
Fun[r_, t_] :=
  0.632 (0.710 \[ExponentialE]^(-1.166 (0.492+ r^2 -
         1.403 r Cos[t])) +
     0.710 \[ExponentialE]^(-1.166 (0.492+ r^2 + 1.403 r Cos[t]))) ;

dataPlot =
  Table[ Fun[r, t], {t, 0.0, 2.0*Pi, 2*Pi/100}, {r, 0.0, 4.0,
    0.08}] ;
MyListPolarPlot3D[ dataPlot, {0.0, 4.0}, {0.0, 2*Pi}, {0, 0.55}]


