XForms/饼图
外观
< XForms
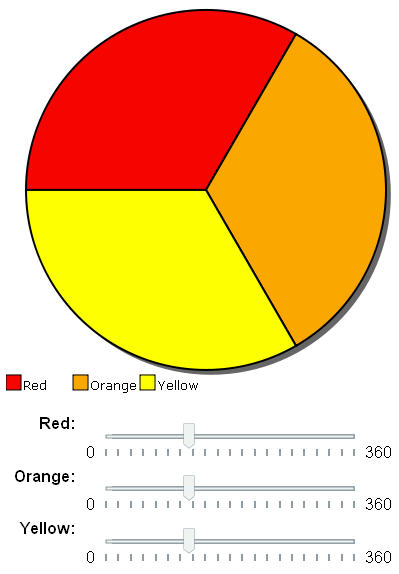
您希望使用范围控件来交互式地更改图形,例如饼图。在本例中,我们使用一个 JavaScript 库来修改SVG 图像。饼图的数据保存在模型中的实例中。

<?xml version="1.0" encoding="iso-8859-1"?>
<html xmlns="http://www.w3.org/1999/xhtml" xmlns:xf="http://www.w3.org/2002/xforms" xmlns:ev="http://www.w3.org/2001/xml-events" xmlns:xsd="http://www.w3.org/2001/XMLSchema" xmlns:xsi="http://www.w3.org/2001/XMLSchema-instance" xmlns:svg="http://www.w3.org/2000/svg" xmlns:xlink="http://www.w3.org/1999/xlink" xmlns:xi="http://www.w3.org/2001/XInclude">
   <head>
      <link rel="stylesheet" href="pie-chart.css" type="text/css" />
      <title>Pie Chart with XForms Range Controls</title>
      <script type="text/javascript" src="pie-chart.js" />
      <xf:model id="theModel">
         <xf:instance id="theData">
            <charts xmlns="">
               <piechart>
                  <wedge01>120</wedge01>
                  <wedge02>120</wedge02>
                  <wedge03>120</wedge03>
                  <wedge04>0.00</wedge04>
               </piechart>
            </charts>
         </xf:instance>
         <!-- Section 2 -->
         <xf:bind nodeset="/charts/piechart/wedge01" type="xsd:decimal" />
         <xf:bind nodeset="/charts/piechart/wedge02" type="xsd:decimal"  />
         <xf:bind nodeset="/charts/piechart/wedge03" type="xsd:decimal" />
         <xf:bind nodeset="/charts/piechart/wedge04" type="xsd:decimal" />
         <xf:bind nodeset="/charts/piechart/wedge04" calculate="/charts/piechart/wedge01 + /charts/piechart/wedge02 + /charts/piechart/wedge03" />
      </xf:model>
   </head>
   <body onload="showChart('chart')">
      <h1>Pie Chart with XForms Range Controls</h1>
      <div id="chart">
         <!-- Placeholder for chart.  Javascript will load here. -->
      </div>
       <br />
      <xf:range ref="/charts/piechart/wedge01" id="s2l1" start="0" end="360" incremental="true">
         <xf:label>Red:</xf:label>
         <xf:action ev:event="xforms-value-changed">
            <xf:load resource="javascript:updateChart('chart')" />
         </xf:action>
      </xf:range>

      <xf:range ref="/charts/piechart/wedge02" start="0" end="360" incremental="true">
         <xf:label>Orange:</xf:label>
         <xf:action ev:event="xforms-value-changed">
            <xf:load resource="javascript:updateChart('chart')" />
         </xf:action>
      </xf:range>

      <xf:range ref="/charts/piechart/wedge03" start="0" end="360" incremental="true">
         <xf:label>Yellow:</xf:label>
         <xf:action ev:event="xforms-value-changed">
            <xf:load resource="javascript:updateChart('chart')" />
         </xf:action>
      </xf:range>
   </body>
</html>
此示例展示了使用鼠标交互式地更改值的一种简洁干净的方法。不需要键盘。以下是第一个范围控件的示例。
<xf:range ref="/charts/piechart/wedge01" start="0" end="360" incremental="true">
    <xf:label>Red:</xf:label>
    <xf:action ev:event="xforms-value-changed">
        <xf:load resource="javascript:updateChart('chart')" />
    </xf:action>
</xf:range>
这是一个示例,说明如何将实例文档用作表单中外部组件的接口。您只需将数据放在实例中,并告诉应用程序获取数据即可。
此示例最初受到 Mozilla 网站上 1040 税表示例的启发。绘制饼图的 JavaScript 代码取自该示例。
