控制系统/开源工具/Scilab
外观
< 控制系统
Scilab是一个开源、跨平台的数值计算包和高级的、面向数值的编程语言。它的功能类似于MATLAB。
Scilab很好地实现了许多必需的控制系统函数,并具有一个名为XCos的动态模型模拟器,这使其成为控制工程师使用的良好工具。
本文将概述实现本华夏公益教科书主要部分中描述的函数所需的 Scilab 方法。
考虑以下二阶传递函数
这在 Scilab 控制台中通过以下方式创建
s = poly(0,'s');                                  // Define the complex number frequency parameter. Alternatively you can use s = %s.
TF = syslin("c", (5*s + 10) / (s^2 +4*s +5))      // Define the linear continuous transfer function
TF  =

    10 + 5s
   ---------
             2
   5 + 4s + s
此传递函数将在本页后续演示中使用。
Scilab 具有执行必要的转换的函数。
转换为状态空间是通过以下方式实现的
SS = tf2ss(TF)                    // TF -> SS
SS  =
      SS(1)   (state-space system:)
!lss  A  B  C  D  X0  dt  !

      SS(2) = A matrix =
 - 2.25  - 0.25
   4.25  - 1.75

      SS(3) = B matrix =
 - 2.7386128
   2.7386128

      SS(4) = C matrix =
 - 1.8257419    1.110D-16

      SS(5) = D matrix =
   0.

      SS(6) = X0 (initial state) =
   0.
   0.

      SS(7) = Time domain =
c
要转换回传递函数,您可以使用
TFx = clean(ss2tf(SS))            // SS -> TF conversion. Clean removes rounding errors and is recommended.
TFx  =

    10 + 5s
   ---------
             2
   5 + 4s + s
阶跃响应是表示动态系统和可视化函数的标准方法。如果我们对示例传递函数进行单位阶跃测试,我们将得到
这是使用以下 Scilab 代码生成的;
t=0:0.01:3;                         // Define a time range for the step test
plot2d(t, csim('step',t,TF));       // csim applies the step test and plot2d produces the graphical output
xlabel("Time [s]");                 // Add a title and label axis
ylabel("y1");
title("Step Response");
xgrid(1, 1, 10);                    // Define a nice grid for the plot to make it easier to read
'csim' 执行通用目的连续模拟函数,可以以各种方式使用。
csim 函数中的第一个参数是应用于传递函数的模拟函数。此参数的选项可以是;
- 阶跃
- 脉冲
- 函数 : [输入]=u(t)
- 列表 : list(ut,parameter1,....,parametern) 使得:输入=ut(t,parameter1,....,parametern) (ut 是一个函数)
- 一个向量,给出对应于每个 t 值的 u 的值
第三个参数(示例中的“TF”)是应用模拟的 SIMO 线性系统。状态空间表示可以代替拉普拉斯表示。
还提供了一个离散时间模拟函数,称为 'dsimul',它可以应用于状态空间方程。
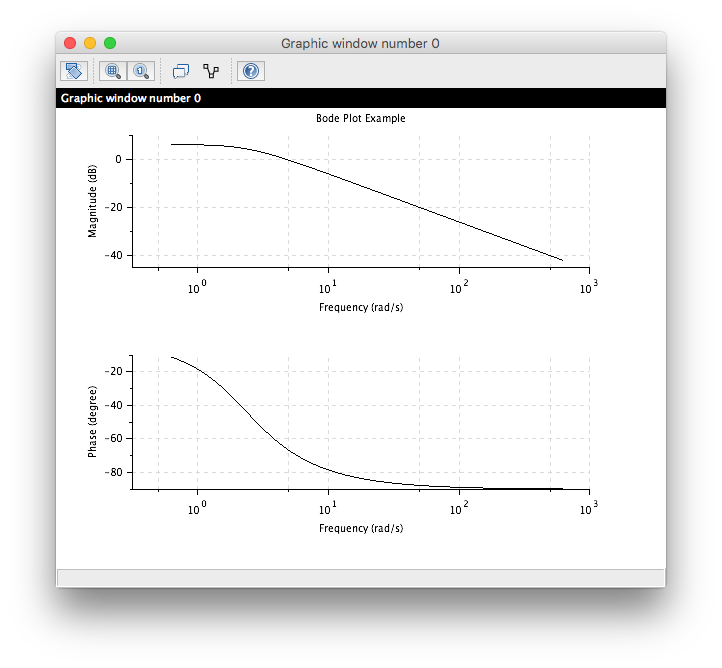
有一个内置命令用于生成伯德图,例如本例;
要生成上面的内容,请使用以下 Scilab 代码
clf();                              // Clears the plotting window
f = 0.1:100;                        // Set-up the frequency range we want
bode(TF, f);                        // Generate the Bode plot
title("Bode Plot Example");         // Add a title
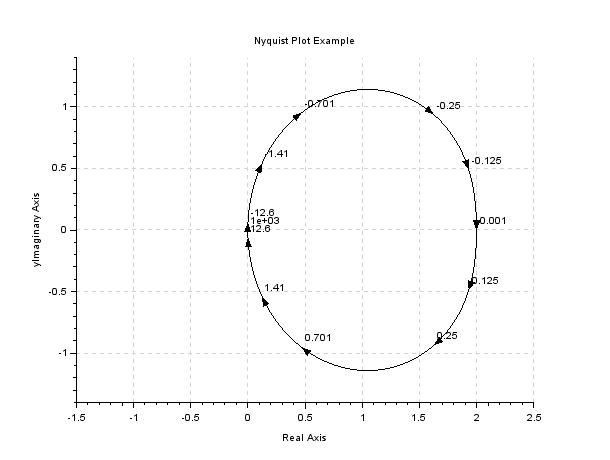
有一个内置命令用于生成奈奎斯特图,例如本例;
要生成上面的内容,请使用以下 Scilab 代码
clf();                              // Clears the plotting window
nyquist(TF);                        // Generate the Bode plot
title("Nyquist Plot Example");      // Add a title and label axis
xlabel("Real Axis");
ylabel("yImaginary Axis");
传递到 nyquist 命令的传递函数可以是连续或离散时间 SIMO 线性动力系统。
奈奎斯特图需要分析稳定性准则。
- Scilab 官方网站
- Scilab Ninja 的控制工程基础演示了 Scilab 在控制系统工作中的使用资源。


