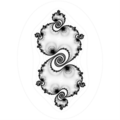
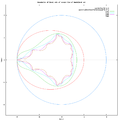
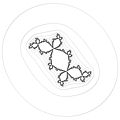
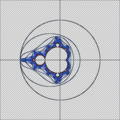
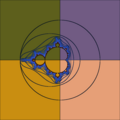
分形/复平面迭代/等势
边界追踪,也称为轮廓追踪,指的是二进制数字区域的边界追踪可以看作是一种分割技术,它识别数字区域的边界像素。边界追踪是分析该区域的重要第一步。边界是一个拓扑概念。然而,数字图像不是拓扑空间。因此,不可能在数学上精确地定义数字图像中边界的概念。关于追踪数字图像 I 子集 S 边界的多数出版物都描述了算法,这些算法找到属于 S 的一组像素,这些像素在其直接邻域内具有属于 S 和其补集 I - S 的像素。根据这个定义,子集 S 的边界不同于补集 I - S 的边界,这是一个拓扑悖论。为了正确地定义边界,有必要引入一个与给定数字图像相对应的拓扑空间。这样的空间可以是二维抽象细胞复形。它包含三个维度的细胞:与数字图像像素相对应的二维细胞,表示位于两个相邻像素之间的短线的单维细胞或“裂缝”,以及对应于像素角点的零维细胞或“点”。然后,子集 S 的边界是裂缝和点的序列,而这些裂缝和点的邻域与子集 S 及其补集 I - S 相交。以这种方式定义的边界完全对应于拓扑定义,也对应于我们对边界的直观想象,因为 S 的边界既不包含 S 的元素,也不包含其补集的元素。它应该只包含位于 S 和补集之间的元素。这正是复形的裂缝和点。这种边界追踪方法在弗拉基米尔·A·科瓦列夫斯基[1] 的书和网站上有所描述。 [2]
- 内部和外部 LCM
-
周期 1
-
周期 1,三次映射
-
周期 2
-
周期 2,平面反转
-
周期 3
-
分而治之
- 势
- 等高线,维基百科中的等值线
- 等势
- 追踪
- 等高线绘制算法
- 边界追踪
- 函数 f 的形状 = 临界水平曲线(包含 f 的临界点的水平曲线)的形状 [3]
用于边界追踪的算法:[4]
- 方形追踪算法 [5]
- Moore 邻域追踪算法
- 径向扫描 [6]
- Theo Pavlidis 算法 [7]
- 可以使用向量代数追踪边界的通用方法可以在以下位置找到。 [8]
- 边界追踪的扩展,用于将追踪的边界分割成开放和封闭子部分,在以下位置有所描述。 [9]
- 水平集边界的边缘检测:水平集方法 (LSM) + 边缘检测(例如 Sobel 滤波器)
- 追踪等值曲线(等值线)
- 吸引子周围的封闭曲线(圆)的反向迭代

在元胞自动机中,Moore 邻域定义在二维方形格子上,由一个中心细胞和围绕它的八个细胞组成。
这个邻域以元胞自动机理论的先驱爱德华·F·摩尔命名。
它是两种最常用的邻域类型之一,另一种是冯·诺依曼邻域,它不包括角点细胞。例如,著名的康威生命游戏就使用了 Moore 邻域。它类似于计算机图形学中 8 连通像素的概念。
一个细胞的 Moore 邻域是指该细胞本身以及与它切比雪夫距离为 1 的细胞。
这个概念可以扩展到更高维度,例如,为三维元胞自动机形成一个 26 细胞立方邻域,就像 3D 生命 所用的一样。在维度 d 中,其中 ,邻域的大小为 3d - 1。
在二维中,给定范围 r 的扩展 Moore 邻域中细胞的数量为 (2r + 1)2。
Moore 邻域公式背后的想法是找到给定图的轮廓。这个想法对 18 世纪的大多数分析师来说是一个巨大的挑战,因此从Moore 图 推导出了一种算法,后来被称为 Moore 邻域算法。
Moore 邻域追踪算法的伪代码如下:
Input: A square tessellation, T, containing a connected component P of black cells.
Output: A sequence B (b1, b2, ..., bk) of boundary pixels i.e. the contour.
Define M(a) to be the Moore neighborhood of pixel a.
Let p denote the current boundary pixel.
Let c denote the current pixel under consideration i.e. c is in M(p).
Let b denote the backtrack of c (i.e. neighbor pixel of p that was previously tested)

Begin
  Set B to be empty.
  From bottom to top and left to right scan the cells of T until a black pixel, s, of P is found.
  Insert s in B.
  Set the current boundary point p to s i.e. p=s
  Let b = the pixel from which s was entered during the image scan.
  Set c to be the next clockwise pixel (from b) in M(p).
  While c not equal to s do
    If c is black
      insert c in B
      Let b = p
      Let p = c
      (backtrack: move the current pixel c to the pixel from which p was entered)
      Let c = next clockwise pixel (from b) in M(p).
    else
      (advance the current pixel c to the next clockwise pixel in M(p) and update backtrack)
      Let b = c
      Let c = next clockwise pixel (from b) in M(p).
    end If
  end While
End
最初终止条件是在第二次访问起始像素后停止。 这限制了算法将完全遍历的轮廓集。 Jacob Eliosoff 提出的改进停止条件是在您最初进入相同方向的第二个时间进入起始像素后停止。
David Rand 描述[12]
The plotting algorithm can be summarized thus:

a) Given a matrix of floating point values which are the values of a function z = f(x,y) given at the nodes of a grid of x and y values (the grid values are assumed equally spaced, although the horizontal and vertical spacing may differ), the program determines the minimum and maximum values of z and then computes a number of contour values (in this implementation, 10 values) by linear or logarithmic interpolation between the extrema.

b) The program "walks" about the grid of points looking for any segment (i.e. a line joining two adjacent nodes in the grid) which must be crossed by one of the contours because some contour value lies between the values of z at the nodes.

c) Having found such a segment, it finds the intersection point of the contour and the segment by linear interpolation between the nodes. It also stores the information that the current contour value has been located on the current segment, so that this operation will not be repeated.

d) The program then attempts to locate a neighbouring segment having a similar property - that is, crossed by the same contour. If it finds one, it determines the intersection point as in step c) and then draws a straight line segment joining the previous intersection point with the current one. This step is repeated until no such neighbour can be found, taking care to exclude any segment which has already been dealt with.

e) Steps b), c) and d) are repeated until no segment can be found whose intersection with any contour value has not already been processed.
方形跟踪算法简单而有效。 它的行为完全基于您是在黑色还是白色单元格上(假设白色单元格是形状的一部分)。 首先,从左上角扫描到右侧,并逐行扫描。 进入第一个白色单元格后,算法的核心就开始了。 它主要包含两个规则
- 如果您在白色单元格中,则向左移动。
- 如果您在黑色单元格中,则向右移动。
请记住,您如何进入当前单元格很重要,因此可以定义左右。
public void GetBoundary(byte[,] image)
{
    for (int j = 0; j < image.GetLength(1); j++)
        for (int i = 0; i < image.GetLength(0); i++)
            if (image[i, j] == 255)               // Found first white pixel
                SquareTrace(new Point(i, j));
}

public void SquareTrace(Point start)
{
    HashSet<Point> boundaryPoints = new HashSet<Point>();  // Use a HashSet to prevent double occurrences
    // We found at least one pixel
    boundaryPoints.Add(start);

    // The first pixel you encounter is a white one by definition, so we go left.
    // Our initial direction was going from left to right, hence (1, 0)
    Point nextStep = GoLeft(new Point(1, 0));
    Point next = start + nextStep;
    while (next != start)
    {
        // We found a black cell, so we go right and don't add this cell to our HashSet
        if (image[next.x, next.y] == 0)
        {
            next = next - nextStep;
            nextStep = GoRight(nextStep);
            next = next + nextStep;
        }
        // Alternatively we found a white cell, we do add this to our HashSet
        else
        {
            boundaryPoints.Add(next);
            nextStep = GoLeft(nextStep);
            next = next + nextStep;
        }
    }
}

private Point GoLeft(Point p) => new Point(p.y, -p.x);
private Point GoRight(Point p) => new Point(-p.y, p.x);
- 在参数平面上
- c = -0.752174630125934 +0.057670473174377*i。 势能 = 2.108396223015232e-16
- c = -0.750087705298239 +0.014275963195317 *i,(Mandel 不能绘制这样的等势线)
- otis 由 Tomoki Kawahira 开发
- mandel 由 Wolf Jung 开发
- ofxContourPlot by Eva Schindling- 数学函数 f(x,y) 的轮廓绘图
- xd3d
- 分形缩放器
- 来自 Mandel 的 C++ 代码,由 Wolf Jung 开发
- 轮廓跟踪库 : 用于跟踪轮廓的二维库。 由 STPR 开发。
- 使用 C 语言实现论文“通过边界跟踪对数字化二值图像进行拓扑结构分析”
- A-C-实现-改进-轮廓-绘图 (c++)
- 等高线
- 在 Maxima CAS 中[13]
- Fortran 中的 conplot
- Paul Bourke:conrec
- c 代码
- d3 - js 库
- 迈克尔·费曼 1981 年 8 月的论文《改进的轮廓绘图算法的实现》
来自 Maxima CAS 的 Lisp 代码
函数 ploteq
ploteq (exp, ...options...)
绘制 exp 的等势曲线,exp 应该是依赖于两个变量的表达式。 曲线是通过积分定义正交轨迹的微分方程得到的,该正交轨迹是通过给定表达式的梯度得到的自治系统的解。 图表也可以显示该梯度系统的积分曲线(选项 fieldlines)。
即使从控制台中的 Maxima 会话运行,该程序也需要 Xmaxima,因为绘图将由 Xmaxima 中的 Tk 脚本创建。 默认情况下,绘图区域将为空,直到用户单击一个点(或在设置菜单中或通过 trajectory_at 选项提供其坐标)。
plotdf 接受的大多数选项也可以用于 ploteq,并且绘图界面与 plotdf 中描述的相同。
示例
  load("plotdf.lisp")$
  V: 900/((x+1)^2+y^2)^(1/2)-900/((x-1)^2+y^2)^(1/2)$
  ploteq(V,[x,-2,2],[y,-2,2],[fieldlines,"blue"])$
单击一个点将绘制经过该点的等势曲线(红色)和正交轨迹(蓝色)。
源代码文件
- share/dynamics/dynamics.mac
- share/diffequations/drawdf.mac
- share/dynamics/plotdf.lisp
;; plotdf.mac - Adds a function plotdf() to Maxima, which draws a Direction
;;              Field for an ordinary 1st order differential equation,
;;              or for a system of two autonomous 1st order equations.
;;
;; Copyright (C) 2004, 2008, 2011 Jaime E. Villate <villate@fe.up.pt>
;;


;; plot equipotential curves for a scalar field f(x,y)
(defun $ploteq (fun &rest options)

  (let (file cmd mfun (opts " ") (s1 '$x) (s2 '$y))
    (setf mfun `((mtimes) -1 ,fun))
    ;; if the variables are not x and y, their names must be given right
    ;; after the expression for the ode's
    (when
      (and (listp (car options)) (= (length (car options)) 3)
            (or (symbolp (cadar options)) ($subvarp (cadar options)))
            (or (symbolp (caddar options)) ($subvarp (caddar options))))
      (setq s1 (cadar options))
      (setq s2 (caddar options))
      (setq options (cdr options)))
    (defun subxy (expr)
      (if (listp expr)
          (mapcar #'subxy expr)
          (cond ((eq expr s1) '$x) ((eq expr s2) '$y) (t expr))))
    (setf mfun (mapcar #'subxy mfun))
;; the next two lines should take into account parameters given in the options
;;    (if (delete '$y (delete '$x (rest (mfuncall '$listofvars ode))))
;;        (merror "The equation(s) can depend only on 2 variable which must be specified!"))
    (setq cmd (concatenate 'string " -dxdt \""
			   (expr_to_str (mfuncall '$diff mfun '$x))
			   "\" -dydt \""
			   (expr_to_str (mfuncall '$diff mfun '$y))
			   "\" "))

    ;; parse options and copy them to string opts
    (cond (options
           (dolist (v options)
             (setq opts (concatenate 'string opts " "
                                  (plotdf-option-to-tcl v s1 s2))))))

    (unless (search "-vectors " opts)
      (setq opts (concatenate 'string opts " -vectors {}")))
    (unless (search "-fieldlines " opts)
      (setq opts (concatenate 'string opts " -fieldlines {}")))
    (unless (search "-curves " opts)
      (setq opts (concatenate 'string opts " -curves {red}")))
    (unless (search "-windowtitle " opts)
      (setq opts (concatenate 'string opts " -windowtitle {Ploteq}")))
    (unless (search "-xaxislabel " opts)
      (setq opts (concatenate 'string opts " -xaxislabel " (ensure-string s1))))
    (unless (search "-yaxislabel " opts)
      (setq opts (concatenate 'string opts " -yaxislabel " (ensure-string s2))))

    (setq file (plot-temp-file (format nil "maxout~d.xmaxima" (getpid))))
    (show-open-plot
     (with-output-to-string
         (st)
       (cond ($show_openplot (format st "plotdf ~a ~a~%" cmd opts))
             (t (format st "{plotdf ~a ~a}" cmd opts))))
     file)
    file))
- ↑ Kovalevsky,V.,图像处理与蜂窝拓扑,施普林格 2021,ISBN 978-981-16-5771-9
- ↑ http://www.kovalevsky.de,讲座“跟踪二维图像中的边界”
- ↑ mathoverflow.net 问题:有理函数的形状是什么 ?
- ↑ 轮廓跟踪算法
- ↑ Abeer George Ghuneim:方形跟踪算法
- ↑ Abeer George Ghuneim:径向扫描算法
- ↑ Abeer George Ghuneim:Theo Pavlidis 算法
- ↑ 基于向量代数的二值图像中物体外部和内部边界的跟踪,工程科学进展杂志第 3 卷第 1 期,2010 年 1 月至 6 月,第 57-70 页 [1]
- ↑ 基于图论的跟踪边界到开放和封闭子部分的分割,计算机视觉与图像理解,第 115 卷第 11 期,2011 年 11 月,第 1552-1558 页 [2]
- ↑ David Rand 编写的 Java 轮廓绘图
- ↑ stackoverflow 问题:实现轮廓绘图的方法
- ↑ ContourPlottinginJava 由 D Rand 开发
- ↑ 由 Josef Boehm 和 Leon Magiera 解决的...


