R 编程/图形
R 至少包含三个图形系统,标准的 graphics 包,用于 Trellis 图的 lattice 包[1] 以及图形语法 ggplot2 包[2]。R 具有良好的图形功能,但有一些替代方案,例如 gnuplot。
交互式图形
[edit | edit source]本节讨论了一些在不使用 R 脚本的情况下绘制图形的方法。
playwith 包提供了一个图形用户界面来定制图形,添加标题、网格、一些文本等,它会导出您需要的 R 代码,如果您想复制分析[3]。如果您想了解更多信息,可以查看网站上的屏幕截图 (链接)。另请参阅“R you Ready”上的示例 [1]。此包需要 GTK+ 库。
library("playwith")
playwith(plot(x1))
还有一个图形用户界面 GrapheR,它使初学者非常容易绘制图形[4]。此解决方案是跨平台的。
> library(GrapheR)
latticist (链接) 是另一个类似的项目。
另请注意,一些图形用户界面,例如 RKward 和 R Commander,使得绘制图形变得容易。
标准 R 图形
[edit | edit source]在本节中,我们将介绍如果您想在默认图形系统中定制图形,您需要了解的内容。
plot()是图形的主要函数。参数可以是单个点,例如 0 或 c(.3,.7),单个向量,一对向量或许多其他 R 对象。par()是另一个重要的函数,它定义了绘图的默认设置。- 还有许多其他绘图函数,它们特定于某些任务,例如
hist()、boxplot()等。它们中的大多数都接受与plot()函数相同的参数。
> N <- 10^2
> x1 <- rnorm(N)
> x2 <- 1 + x1 + rnorm(N)
> plot(0)
> plot(0,1)
> plot(x1)
> plot(x1,x2) # scatter plot x1 on the horizontal axis and x2 on the vertical axis
> plot(x2 ~ x1) # the same but using a formula (x2 as a function of x1)
> methods(plot) # show all the available methods for plot (depending on the number of loaded packages).
标题、图例和注释
[edit | edit source]标题
[edit | edit source]main 给出主标题,sub 给出副标题。它们可以作为 plot() 函数的参数传递,也可以使用 title() 函数。xlab 为 x 轴的名称,ylab 为 y 轴的名称。
 plot(x1,x2, main = "Main title", sub = "sub title" , ylab = "Y axis", xlab = "X axis")
 plot(x1,x2 ,  ylab = "Y axis", xlab = "X axis")
 title(main = "Main title", sub = "sub title" )
文本的大小可以使用参数 cex.main、cex.lab、cex.sub、cex.axis 来修改。这些参数定义了缩放因子,即参数的值乘以文本的大小。如果您选择 cex.main=2,则主标题将是平时大小的两倍。
图例
[edit | edit source]legend()。位置可以是“bottomleft”、“bottomright”、“topleft”、“topright”或精确坐标。
plot(x1, type = "l", col = 1, lty = 1)
lines(x2, col = 2, lty = 2)
legend("bottomleft", legend = c("x1","x2"), col = 1:2, lty = 1:2)
边距中的文本
[edit | edit source]mtext() 将一些文本放在边距中。边距可以在底部 (1)、左侧 (2)、顶部 (3) 或右侧 (4)。
plot(x1, type = "l", col = 1, lty = 1) ; mtext("some text", side = 1) # the bottom
plot(x1, type = "l", col = 1, lty = 1) ; mtext("some text", side = 2) # the left
plot(x1, type = "l", col = 1, lty = 1) ; mtext("some text", side = 3) # the top
plot(x1, type = "l", col = 1, lty = 1) ; mtext("some text", side = 4) # the right margin
图形中的文本
[edit | edit source]text()
数学注释
[edit | edit source]我们可以使用 expression() 添加数学符号,并在公式中使用 substitute() 进行一些替换。
?plotmath # gives help for mathematical annotations
类型
[edit | edit source]绘图的类型可以是
n表示无(不打印任何内容),p表示点,l表示线,b表示两者,o表示两者叠加,h表示直方图状- 以及
s/S表示阶梯。
轴
[edit | edit source]默认输出会打印轴。我们可以使用 axes=FALSE 来移除它们。我们也可以使用 axis() 函数来更改它们。
> plot(x1,x2,axes=FALSE)
>
> plot(x1,x2,axes=FALSE)
> axis(1,col="red",col.axis="blue",font.axis=3)
> axis(2,col="red",col.axis="blue",font.axis=2,las=2)
las 指定轴标签的样式。它可以是 0、1、2 或 3。
- 0 : 始终平行于轴 [默认],
- 1 : 始终水平,
- 2 : 始终垂直于轴,
- 3 : 始终垂直。
还可以通过添加 axis(4,) 在右侧添加另一个 y 轴。
边距
[edit | edit source]| 本节是存根。 您可以通过 扩展它 来帮助华夏公益教科书。 |
边距可以用英寸或行来计算。默认值为 par(mar = c(5,4,4,2)),这意味着底部有 5 行,左侧有 4 行,顶部有 4 行,右侧有 2 行。这可以使用 par() 函数来修改。如果您想以英寸为单位指定边距,请使用 par(mai = c(bottom, left, top, right)。如果您想以行为单位修改边距,请使用 par(mar = c(bottom, left, top, right)。请参阅 ?par 了解有关此主题的更多信息。
可以使用col参数更改点或线的颜色,fg用于前景颜色(框和轴),bg用于背景颜色。
show.col(object=NULL)(Hmisc)包绘制主要 R 颜色及其数字代码。- R 中所有颜色的列表 (pdf)
colors() # list the r colors
show.col(object=NULL) # graphs the main R colors
plot(x1, col = "blue")
plot(x1, col = "red")
plot(x1, col = "red", col.axis = "dodgerblue", col.lab = "firebrick", col.main = "darkgreen", col.sub = "cyan4", main = "Testing colors", sub = "sub titles", ylab = "y axis", xlab = "x axis")
- 我们还可以使用
rgb()函数生成新颜色。第一个参数是红色的强度,第二个是绿色的强度,第三个是蓝色的强度。默认情况下它们在 0 到 1 之间变化,但可以使用选项max = 255进行修改。col2rgb()返回 R 颜色的 RGB 代码。col2hex()(gplots)给出十六进制代码。col2grey()和col2gray()(TeachingDemos)将颜色转换为灰度。
> mycolor <- rgb(.2,.4,.6)
> plot(x1, col = mycolor)
> col2rgb("pink")
      [,1]
red    255
green  192
blue   203
> library("gplots")
> col2hex("pink")
[1] "#FFC0CB"
对于点,可以使用pch选项更改符号,该选项取 0 到 25 之间的整数值或单个字符。pch也可以取向量作为参数。在这种情况下,第一个点将使用向量的第一个元素作为符号,依此类推。
plot(x1, type = "p", pch = 0)
plot(x1, type = "p", pch = 10)
plot(x1, type = "p", pch = 25)
plot(x1, type = "p", pch = "a")
plot(x1, type = "p", pch = "*")
plot(x1[1:26], type = "p", pch = 0:25)
plot(x1[1:26], type = "p", pch = letters)
以下代码在同一图上显示所有符号
x <- rep(1,25)
plot(x, pch = 1:25, axes = F, xlab = "", ylab = "")
text(1:25,.95,labels = 1:25)
points()将点添加到现有图中。
> plot(x1, pch = 0) # plot x1
> points(x2, pch = 1, col = "red") # add x2 to the existing plot
我们可以使用lty更改线型。参数是一个字符串("blank"、"solid"、"dashed"、"dotted"、"dotdash"、"longdash"或"twodash")或一个整数(0=blank、1=solid(默认)、2=dashed、3=dotted、4=dotdash、5=longdash、6=twodash)。可以使用lwd更改线宽。默认值为lwd=1。lwd=2意味着宽度是正常宽度的两倍。
plot(x1, type = "l", lty = "blank")
plot(x1, type = "l", lty = "solid")
plot(x1, type = "l", lty = "dashed")
plot(x1, type = "l", lty = "dotted")
plot(x1, type = "l", lty = "dotdash")
plot(x1, type = "l", lty = "longdash")
plot(x1, type = "l", lty = "twodash")
lines()在图形上添加额外的线。
plot(x1, type = "l", lty = "solid")
lines(x2, type = "l", lty = "dashed", col = "red")
abline()在当前图上添加水平线 (h=)、垂直线 (v=) 或线性函数 (a= 为常数,b= 为斜率)。abline()还可以绘制回归线。
> plot(x1, type = "l", lty = "solid")
> abline(h= -3, lty = "dashed", col = "gray")
> abline(v = 0, lty = "dashed", col = "gray")
> abline(a = -3 , b = .06, lty = "dotted", col = "red")
每个图都由一个框框起来。bty指定框类型。
plot(x1, bty = "o") # the default
plot(x1, bty = "n") # no box
plot(x1, bty = "l")
plot(x1, bty = "7")
plot(x1, bty = "u")
plot(x1, bty = "c")
plot(x1, bty = "]")
另请参见box(),它将一个框添加到现有图中。
grid()在当前图形上添加一个网格。
> plot(x1)
> grid()
虽然网格有一个可选参数 nx 用于设置网格线的数量,但无法明确地告诉它将这些线放在哪里(它通常不会将它们放在整数值处)。更精确且易于管理的替代方法是使用 abline()。
> abline(v=(seq(0,100,5)), col="lightgray", lty="dotted")
> abline(h=(seq(0,100,5)), col="lightgray", lty="dotted")
| 本节是存根。 您可以通过 扩展它 来帮助华夏公益教科书。 |
| 本节是存根。 您可以通过 扩展它 来帮助华夏公益教科书。 |
我们还可以使用calibrate包中的circle()函数将圆圈添加到图中。
您可以选择图表的背景。例如,您可以使用par(bg=)更改背景颜色。
par(bg="whitesmoke")
par(bg="transparent")
matplot()可以同时绘制多个图。
N <- 100
x1 <- rnorm(N)
x2 <- rnorm(N) + x1 + 1
y <- 1 + x1 + x2 + rnorm(N)
mydat <- data.frame(y,x1,x2)
matplot(mydat[,1],mydat[,2:3], pch = 1:2)
使用par(),我们可以在同一图上显示多个图形。mfrow = c(3,2)在同一图上打印 6 个图形,有 3 行 2 列。mfcol = c(3,2)执行相同的操作,但顺序不同。
par(mfrow = c(3,2))
plot(x1, type = "n")
plot(x1, type = "p")
plot(x1, type = "l")
plot(x1, type = "h")
plot(x1, type = "s")
plot(x1, type = "S")

par(mfcol = c(3,2))
plot(x1, type = "n")
plot(x1, type = "p")
plot(x1, type = "l")
plot(x1, type = "h")
plot(x1, type = "s")
plot(x1, type = "S")
curve()绘制函数。这可以使用选项add = TRUE添加到现有图中。plot()也可以绘制函数。
curve(x^2, from = -1 , to = 1, main = "Quadratic function", ylab = "f(x)=x^2")

plot(rnorm(100))
curve((x/100)^2, add = TRUE, col = "red")
-
使用
plot()绘制的平方根函数
如何导出图形?
- 首先,您可以绘制图形,并使用上下文菜单(在 Windows 和 Linux 上右键单击,或在 Mac 上按住 Control 键并单击)来复制或保存图形。可用选项取决于您的操作系统。在 Windows 上,您还可以使用 CTRL + C 将当前图形复制到剪贴板作为位图文件(光栅图形),或使用 CTRL + W 将其作为 Windows 图元文件(矢量图形)复制。然后,您可以将其粘贴到其他应用程序中。
- 您可以在绘制之前添加
pdf("filename.pdf")、png("filename.png")、jpeg("filename.jpg")、bmp("filename.bmp")或tiff("filename.tiff"),并在绘制之后添加dev.off(),将图导出为pdf、png、jpeg、bmp或tiff。 - 您还可以使用
savePlot()函数保存现有图形。 - Sweave 还会生成 ps 和 pdf 图形(参见 Sweave 部分)。
最好使用矢量设备,如pdf、ps或svg。
如何知道所有可用设备的列表?
?Devices- 使用
capabilities()函数查看计算机上所有可用设备的列表。
?Devices
> capabilities()
    jpeg      png     tiff    tcltk      X11     aqua http/ftp  sockets
    TRUE     TRUE     TRUE     TRUE    FALSE    FALSE     TRUE     TRUE
  libxml     fifo   cledit    iconv      NLS  profmem    cairo
    TRUE    FALSE     TRUE     TRUE     TRUE     TRUE    FALSE
png("r_plot.png", width = 420, height = 340)
plot(x1, main = " Example")
dev.off()

pdf("r_plot.pdf", width = 420, height = 340)
plot(x1, main = " Example")
dev.off()

postscript(file="graph1.ps",horizontal=F,pagecentre=F,paper="special",width=8.33,height=5.56)
plot(x1, main = "Example")
dev.off()

plot(x1, main = "Example")
savePlot("W:/Bureau/plot.pdf", type = "pdf")
savePlot("W:/Bureau/plot.png", type = "png")
我们还可以使用svg()函数导出到SVG。
svg("scatterplot.svg", width = 7, height = 7)
plot(x, y)
dev.off()
RSvgDevice库在 R 的早期版本中使用,现在似乎已经过时。
animation包提供了动态图形功能。可以将动画导出为 flash、mpeg 或 gif 格式。aniwiki 网站上有更多示例:http://animation.yihui.name/。
您还可以使用googleVis包创建运动图表[5]。
iplots包提供了一种在 R 中进行交互式数据可视化的方式[6] ·[7]。
要创建可以在网络浏览器中查看的交互式动画绘图,可以使用 animint 包。主要思路是将交互式动画定义为一个包含两个新美学特征的 ggplots 列表
- showSelected=变量表示仅显示对应于变量所选值的子集数据。
- clickSelects=变量表示单击绘图元素将更改变量的当前所选值。
在本节中,我们回顾了各种统计图,并回顾了使用 R 绘制它们的各种替代方法。这包括标准图形包、lattice 包和 ggplot2 包的代码。此外,我们还从 commons 仓库 中添加了一些示例。我们只添加了包含 R 代码的示例。您可以点击任何图形并找到 R 代码。
要绘制折线图,请使用通用 plot() 函数并设置 type="l"。
> x <- seq(0, 2*pi, pi/10)
> plot(x, sin(x), type="l")
然后,您可以使用 lines() 函数在同一绘图上添加更多线条。
> lines(x, cos(x))
plot(x,y)plot(y ~ x)xyplot(y ~ x)(lattice)qplot(x,y)(ggplot2)
有时,绘制变量的对数并对轴使用对数刻度非常有用。可以使用 plot() 函数中的 log 选项来绘制变量的对数。
- 对于对数对数图,使用
log = "xy" - 对于仅在 x 轴上的对数,使用
log = "x" - 对于仅在 x 轴上的对数,使用
log = "y"
plot(x, y , log = "xy")
- 可以使用
text()函数添加标签。 textxy()(calibrate) 使添加标签变得容易。
N <- 10
u <-rnorm(N)
x <- 1 + rnorm(N)
y <- 1 + x + u
plot(x, y)
textxy(x, y,labs = signif(x,3), cx=0.7)
hist()histogram()(lattice)
您可以在 非参数方法 页面了解更多关于直方图的信息。
boxplot()
参见维基百科上的 条形图。
barplot()以表格作为参数并返回条形图。qlot()(ggplot2) 使用geom = "bar"选项以变量作为参数并返回条形图[8]。barchart()以变量作为参数并返回条形图。
另请参见维基百科上的 点图。
- dotchart()
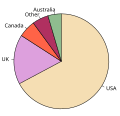
pie()
| 本节是存根。 您可以通过 扩展它 来帮助华夏公益教科书。 |
treemap 包中的 tmPlot() 函数使得绘制 树状图 变得容易。
标准误差条形图对于绘制包含置信区间的多个估计值非常有用。
- Hmisc 包有一个
errbar()函数。此函数以置信区间的上限和下限作为参数[9]。
- Gelman 和 Hill 的 arm 包中的
coefplot()函数。此函数旨在显示估计结果。它以点估计和标准误差作为参数。
coefs <- c(0.2, 1.4, 2.3, 0.5,.3) # vector of point estimates
se <- c(0.12, 0.24, 0.23, 0.15,.2) # standard errors of point estimates
variable <- 1:5 # variable names
library("arm")
# we use CI = qnorm(.975) to have 95% confidence interval
coefplot(coefs, se, variable, vertical = T, CI = qnorm(.975))
coefplot(coefs, se, variable, vertical = F, CI = qnorm(.975))
library("Hmisc")
errbar(variable, coefs, coefs - qnorm(.975) * se, coefs + qnorm(.975) * se)
另请参阅
- sfsmisc 包中还有另一个
errbar()函数。 plotCI()(gplots) 也绘制误差条。plotmeans()(gplots)ciplot()(hacks)- 另请参见维基百科上的 误差条。
contour(),image(),persp()plot3d()(rgl)wireframe()(lattice)
- 点击图形查看 R 代码
-
使用
wireframe()(lattice) 的示例
| 本节是存根。 您可以通过 扩展它 来帮助华夏公益教科书。 |
也可以绘制弧形图[12]。
| 本节是存根。 您可以通过 扩展它 来帮助华夏公益教科书。 |
可以在 R 中绘制树状图[13]。
可以使用 treemap 包中的 treemap() 函数绘制树状图[14]。
有
- wordcloud 包中的
wordcloud()函数 - tagcloud 包中的
tagcloud()函数
- timeline 包中的
timeline()
| 本节是存根。 您可以通过 扩展它 来帮助华夏公益教科书。 |
- ↑ D. Sarkar。Lattice:使用 R 进行多元数据可视化。Springer,2008。 ISBN 9780387759685.
- ↑ ggplot2:用于数据分析的优雅图形(使用 R),作者:Hadley Wickham,以及他自己的网站上的一些示例:http://had.co.nz/ggplot2/
- ↑ playwith:http://code.google.com/p/playwith/
- ↑ Hervé,Maxime (2011)。 "GrapheR:用于在 R 中绘制可自定义图形的多平台 GUI" (PDF)。The R Journal。3 (2)。
- ↑ googleVis 包的教程:http://stackoverflow.com/questions/4646779/embedding-googlevis-charts-into-a-web-site/4649753#4649753
- ↑ http://www.r-bloggers.com/interactive-graphics-with-the-iplots-package-from-%E2%80%9Cr-in-action%E2%80%9D/
- ↑ http://www.r-statistics.com/2012/01/interactive-graphics-with-the-iplots-package-from-r-in-action/ 使用 iplots 包进行交互式图形] - R 实战 一书中的一个章节
- ↑ Hadley Wickham ggplot2:用于数据分析的优雅图形,Springer Verlag,2009
- ↑
errbar()中的默认输出在 R 版本 2.8.1 和 R 版本 2.9.2 之间发生了变化。轴不再默认显示 - ↑ Paul Murrell 使用 R 绘制图表,The R Journal,2009 http://journal.r-project.org/2009-1/RJournal_2009-1_Murrell.pdf
- ↑ (示例:使用二叉树图描述伯努利过程)
- ↑ Gaston Sanchez (2013 年 2 月 3 日)。 "R 中的弧形图:悲惨世界". 检索于 2013 年 2 月 5 日。
{{cite web}}: 检查日期值:|accessdate=和|date=(帮助) - ↑ Gaston Sanchez (2012 年 10 月 3 日)。 "7 种在 R 中绘制树状图的方法". 检索于 2013 年 2 月 5 日。
{{cite web}}: 检查日期值:|accessdate=和|date=(帮助); 换行符在|date=中的第 9 个位置 (帮助) - ↑ https://cran.r-project.cn/web/packages/treemap/treemap.pdf
- ↑ http://www.stat.auckland.ac.nz/~paul/RGraphics/rgraphics.html
- ↑ http://had.co.nz/ggplot2/


